We estimated annual air pollution exposures for all our participants from birth to day of recruitment. We have data on five traffic-related air pollutants: nitrogen dioxide, ozone, coarse particulate matter (PM10), fine particulate matter (PM2.5), and sulfur dioxide. These data are part of our environmental research projects.
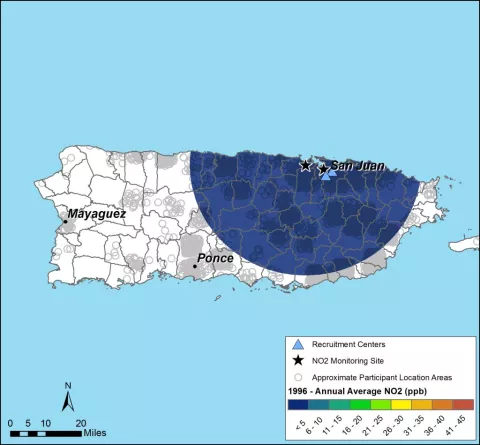
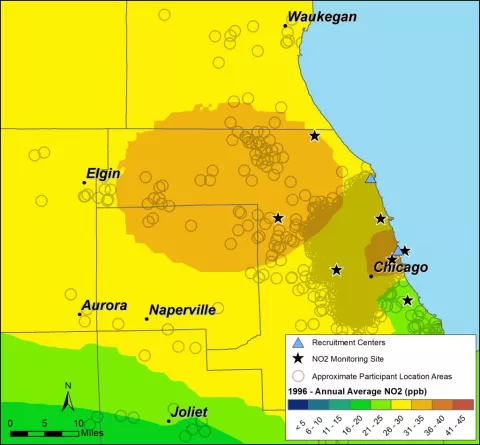
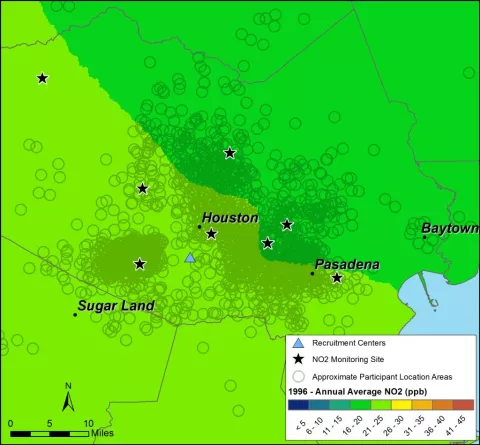
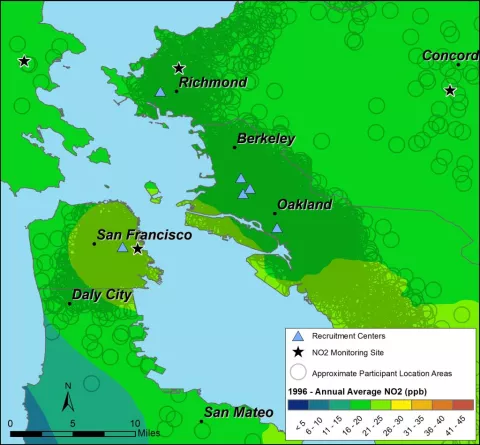
These maps describe the average annual nitrogen dioxide (NO2) exposure in 1996 (the median birth year) in our five study regions. Circles represent participant residences. Open circles with random noise prevent determination of the participant’s address. Solid stars represent monitoring sites. Blue triangles represent recruitment centers. Labels for major cities provide a reference for nearby urban centers.

More: